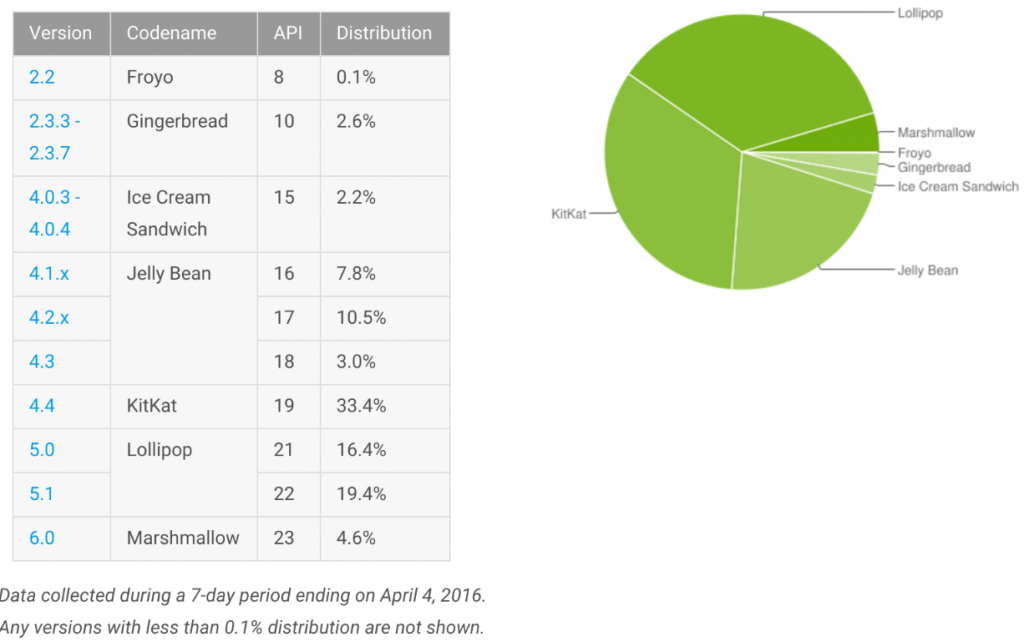
It’s that time of the month again, Google has released the data which shows what versions of Android have been hitting the Play store over the last few days.
The results show that Marshmallow is moving along, doubling market share from 2.3% to 4.6% last year, capitalising on the release of the Android 6.0 running Galaxy S7 line and the very recently released LG G5 in the US. While Froyo and Gingerbread remained static, all other versions of Android dropped in market share except for Android 5.1 which saw a miniscule 0.2% increase in market share, climbing to 19.4%.
As usual, here’s a comparison to last months numbers:
| Android Version | March | April |
| Android 2.2 (Froyo) | 0.1% | 0.1% |
| Android 2.3.3 – 2.3.7 (Gingerbread) | 2.6% | 2.6% |
| Android 4.0.3 – 4.0.4 (Ice Cream Sandwich) | 2.3% | 2.2% |
| Android 4.1.x (JellyBean) | 8.1% | 7.8% |
| Android 4.2.x (JellyBean) | 11.0% | 10.5% |
| Android 4.3 (JellyBean) | 3.2% | 3.0% |
| Android 4.4 (KitKat) | 34.3% | 33.4% |
| Android 5.0 (Lollipop) | 16.9% | 16.4% |
| Android 5.1 (Lollipop) | 19.2% | 19.4% |
| Android 6.0 (Marshmallow) | 2.3% | 4.6% |
Source: Android Developer Dashboard.


ONLY 4+% after 6 months….