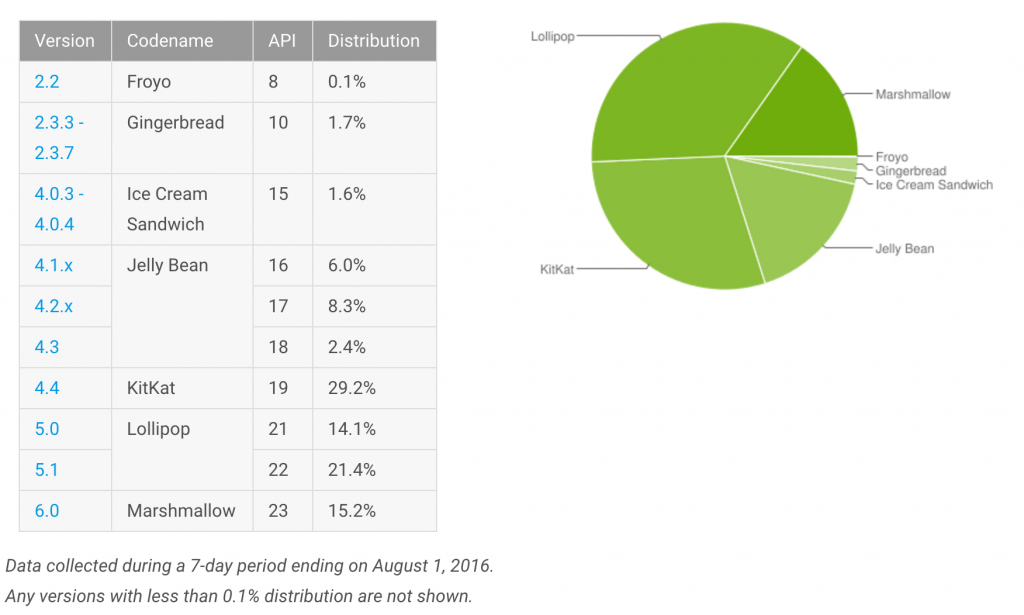
It seems like only a few weeks ago that Google released their distribution numbers (it literally was), but they’ve released them again today and it looks like there’s been some good movement on Marshmallow uptake, while other older versions are still declining.
Marshmallow has jumped to 15.2% adoption, a jump of almost 2%, a move almost echoed by Android 5.1 which saw its own jump up in usage, up 0.6%. All the rest of the other versions of Android listed however – except that almost statistically insignificant Froyo userbase – saw declines in market share. The once mighty Gingerbread version of Android is down to a lowly 1.7%, it’s hard to believe it was almost on 3/4 of Android devices at one stage.
The rest of the numbers are self explanatory for the most part, so for a full run down here’s a comparison to last months numbers:
| Android Version | July | August |
| Android 2.2 (Froyo) | 0.1% | 0.1% |
| Android 2.3.3 – 2.3.7 (Gingerbread) | 1.9% | 1.7% |
| Android 4.0.3 – 4.0.4 (Ice Cream Sandwich) | 1.7% | 1.6% |
| Android 4.1.x (JellyBean) | 6.4% | 6.0% |
| Android 4.2.x (JellyBean) | 8.8% | 8.3% |
| Android 4.3 (JellyBean) | 2.6% | 2.4% |
| Android 4.4 (KitKat) | 30.1% | 29.2% |
| Android 5.0 (Lollipop) | 14.3% | 14.1% |
| Android 5.1 (Lollipop) | 20.8% | 21.4% |
| Android 6.0 (Marshmallow) | 13.3% | 15.2% |


