
It’s a new month, we’ve got our new security patches and now it’s time to look at the reach of the various Android versions.
The data is collated over 7 days by checking the version numbers of devices accessing Google Play. This of course means that any device not accessing Google Play, like a number of Android builds on devices like Amazon’s Fire tablets, and various Chinese vendors aren’t counted. But still this is a decent look.
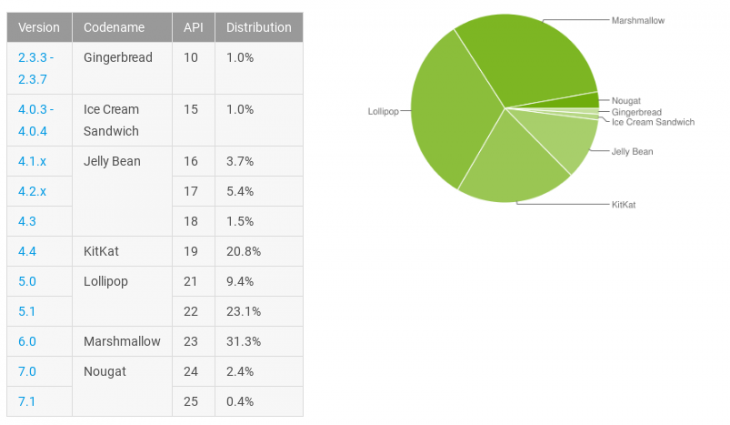
The numbers are fairly static at the earliest versions of Android, with Gingerbread which once dominated the Android version numbers sitting at 1%, as does Ice Cream Sandwich. Jelly Bean is where we start to see declines in numbers with almost 1% decline across the various versions. Even Kit Kat and Lollipop aren’t exempt also showing market share decline.
Marshmallow and Nougat are the big winners this month showing increases across their versions. Nougat climbed from 1.2% market share last month to 2.8% doubling in a short period of time thanks to new device launches. Marshmallow also climbed, likely due to upgrades hitting phones.
For the record, here’s how this months results stack up:
| Android Version | February 2017 | March 2017 |
| Android 2.3.3 – 2.3.7 (Gingerbread) | 1.0% | 1.0% |
| Android 4.0.3 – 4.0.4 (Ice Cream Sandwich) | 1.0% | 1.0% |
| Android 4.1.x (JellyBean) | 4.0% | 3.7% |
| Android 4.2.x (JellyBean) | 5.7% | 5.4% |
| Android 4.3 (JellyBean) | 1.6% | 1.5% |
| Android 4.4 (KitKat) | 21.9% | 20.8% |
| Android 5.0 (Lollipop) | 9.8% | 9.4% |
| Android 5.1 (Lollipop) | 23.1% | 23.1% |
| Android 6.0 (Marshmallow) | 30.7% | 31.3% |
| Android 7.0 (Nougat) | 0.9% | 2.4% |
| Android 7.1 (Nougat) | 0.3% | 0.4% |


