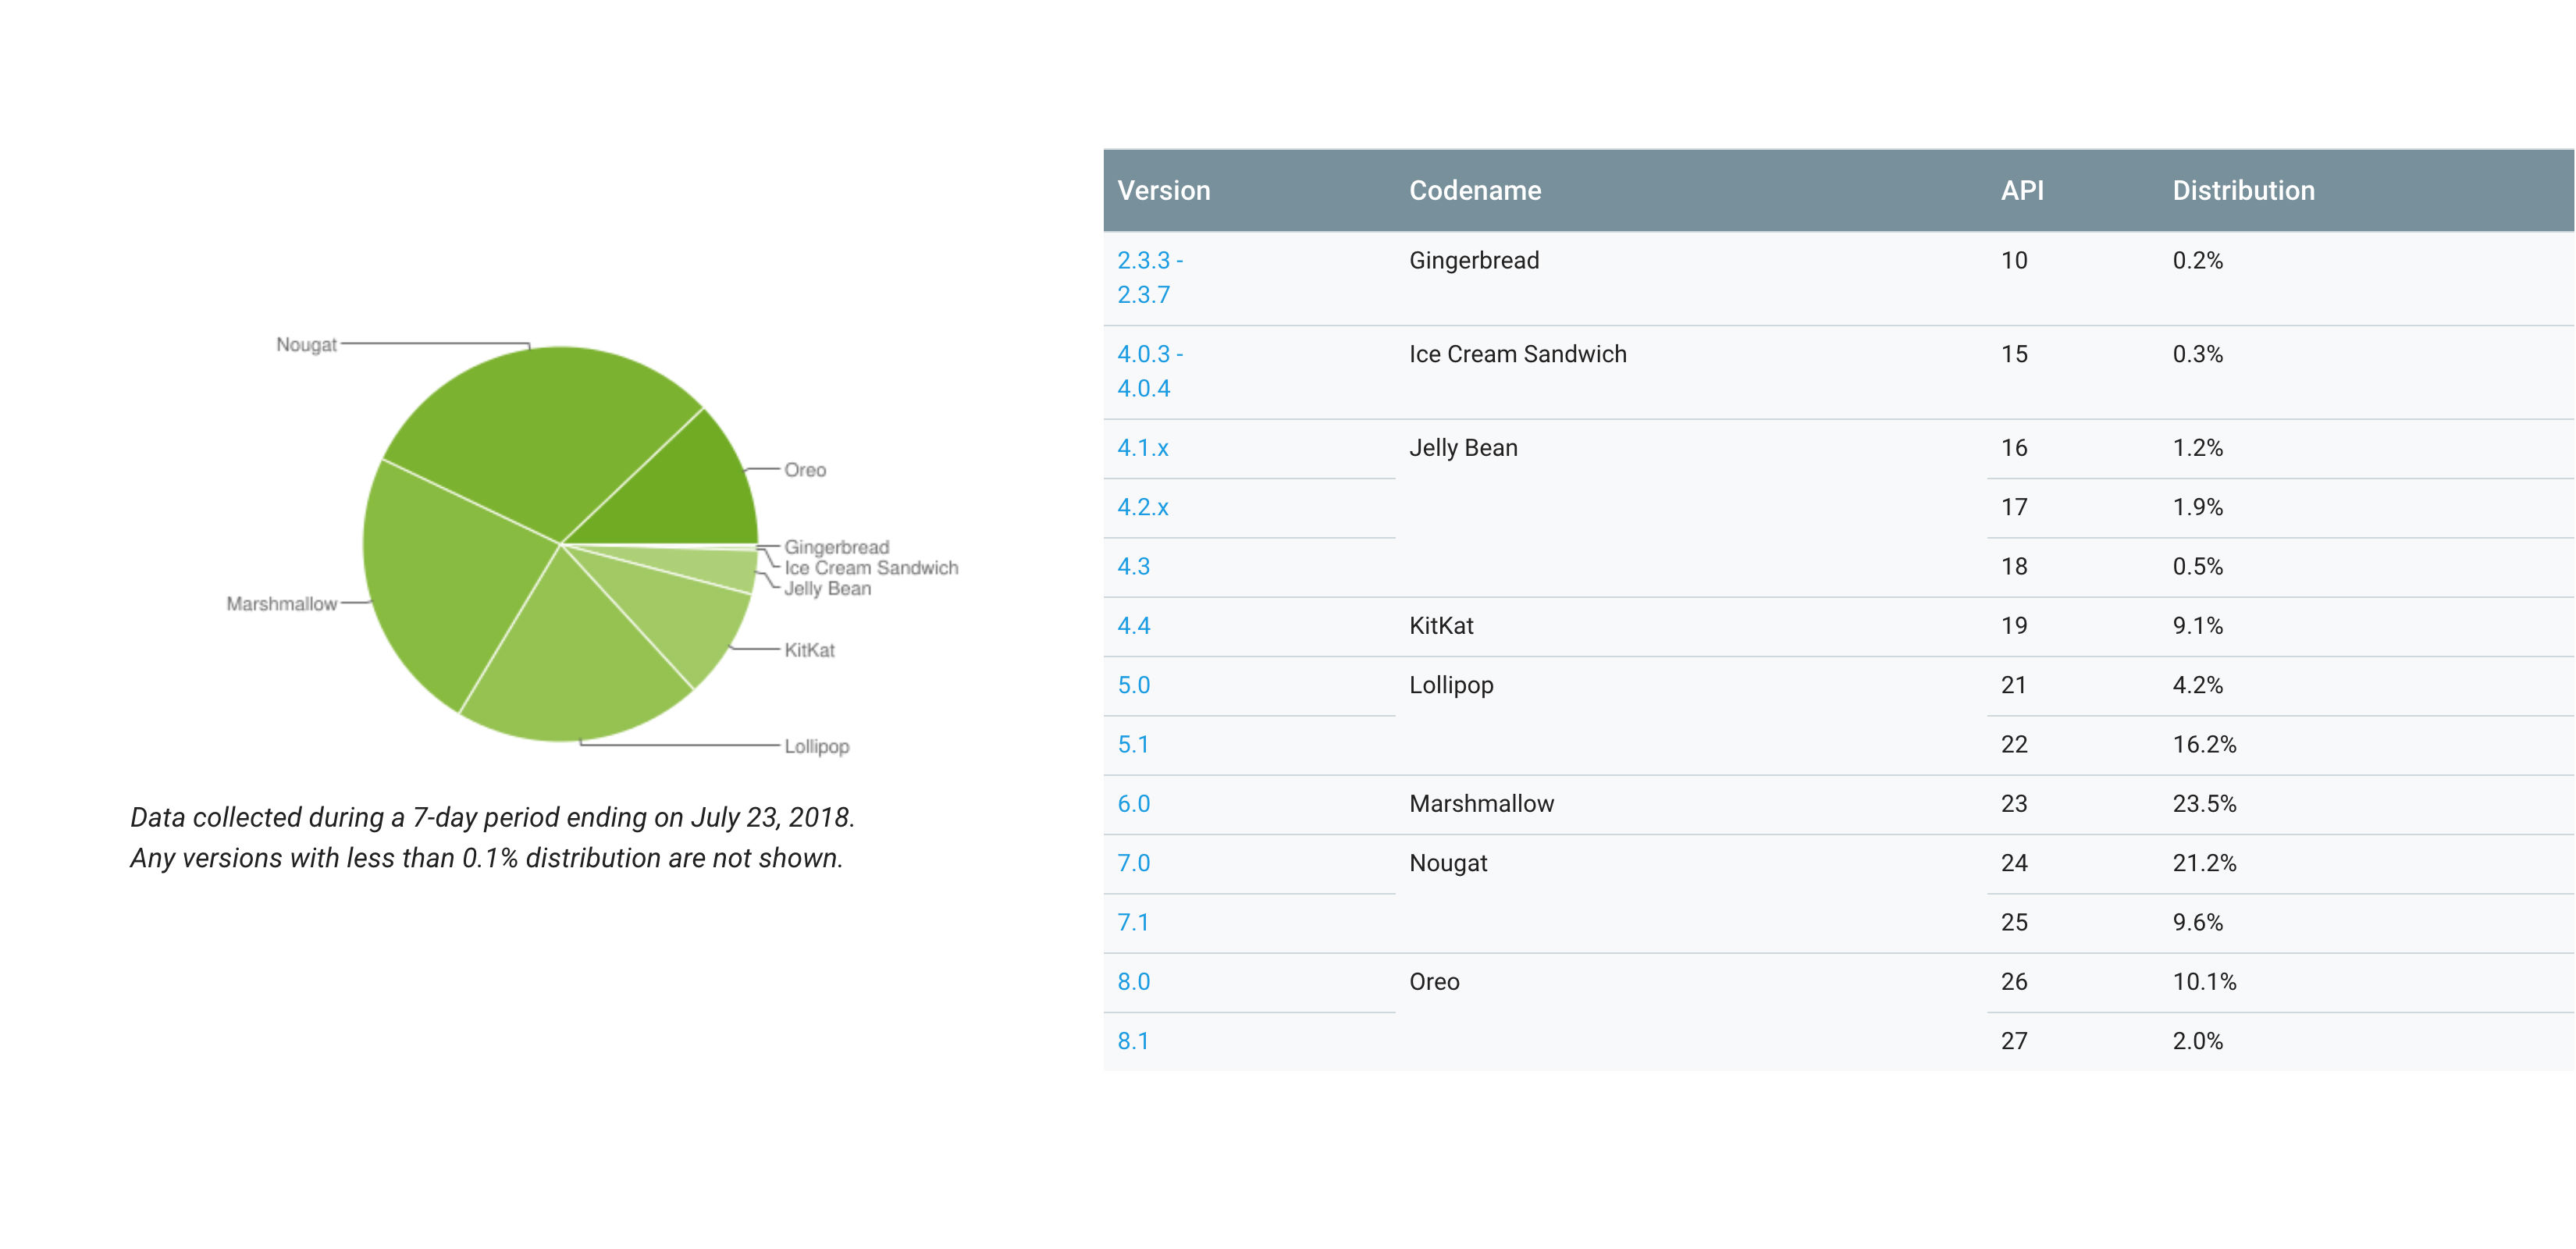
Google has been a little slack in updating the Android Distribution numbers of late, but they’re back this month, with stats showing the distribution of Android versions across devices accessing the Google Play Store during a 7-day period ending on July 23.
The numbers of course are for Google Android, so only those accessing the Google Play Store but they give a good representation of the version numbers that developers need to target when developing apps. Google last updated the numbers in May. Since the last set of numbers, Android has finally seen movement downwards in the use of some of the earlier versions of Android including drops in Gingerbread, Ice Cream Sandwich, JellyBean, Kit Kat, Lollipop, Marshmallow, Nougat 7.0 – but upticks in Android Nougat 7.1 and of course, upticks in adoption in Android 8.0 and 8.1.
For your gratification you can check out the comparison between May and July here:
| Android Version | May 2018 | July 2018 |
| Android 2.3.3 – 2.3.7 (Gingerbread) | 0.3% | 0.2% |
| Android 4.0.3 – 4.0.4 (Ice Cream Sandwich) | 0.4% | 0.3% |
| Android 4.1.x (JellyBean) | 1.5% | 1.2% |
| Android 4.2.x (JellyBean) | 2.2% | 1.9% |
| Android 4.3 (JellyBean) | 0.6% | 0.5% |
| Android 4.4 (KitKat) | 10.3% | 9.1% |
| Android 5.0 (Lollipop) | 4.8% | 4.2% |
| Android 5.1 (Lollipop) | 17.6% | 16.2% |
| Android 6.0 (Marshmallow) | 25.5% | 23.5% |
| Android 7.0 (Nougat) | 22.9% | 21.2% |
| Android 7.1 (Nougat) | 8.2% | 9.6% |
| Android 8.0 (Oreo) | 4.9% | 10.1% |
| Android 8.1 (Oreo) | 0.8% | 2.0% |


