It’s been almost two months since we saw the release of the Android Distribution numbers, but then releasing a major version of Android will certainly put things like this by the wayside for the time being.
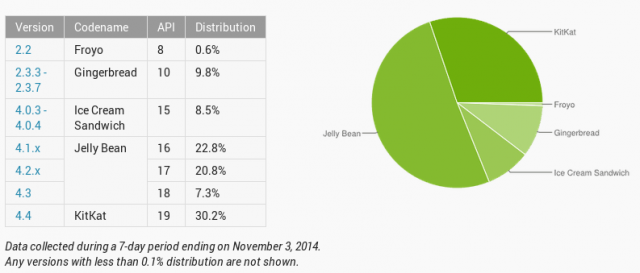
Google has today released the latest numbers, which were gathered in the 7-days leading up to November 3rd and they’re looking pretty good. KitKat now runs on over 30% of devices, up from 24.5% last time we checked in. Jelly Bean is a mish-mash of results, with small gains for some sub-versions and losses in others. Ice-Cream Sandwich has seen a drop of over a full percent. Gingerbread has finally dropped under 10%. The comparison over the last results are below for your viewing pleasure.
| Android Version | July/August | September |
| Android 2.2 (Froyo) | 0.7% | 0.6% |
| Android 2.3.3 – 2.3.7 (Gingerbread) | 11.6% | 9.8% |
| Android 4.0.3 – 4.0.4 (Ice Cream Sandwich) | 9.6% | 8.5% |
| Android 4.1.x (JellyBean) | 25.1% | 22.8% |
| Android 4.2.x (JellyBean) | 20.7% | 20.8% |
| Android 4.3 (JellyBean) | 8.0% | 7.3% |
| Android 4.4 (KitKat) | 24.5% | 30.2% |
Source: Android Developer Dashboard.


Interesting that of the JB flavours, 4.1.x is still the most popular.
I’ve got two devices running Lollipop so I’m sure there are more!
No Lollipop stats?