Another month, another look at where the Google enabled versions of Android sit in terms of market share. The numbers are collated based on devices hitting the Play Store in the last 7 days, and allow developers to target their apps at popular platforms, so what do the numbers tell us this month?
Marshmallow almost doubled the 1.2% market share reported last month, climbing to 2.3% market share 5 months after it was released. Lollipop has seen some decline and an increase depending on the version, but overall, older versions of Android are trending downwards in usage.
With more Marshmallow devices about to hit the market – LG’s G5 and Samsung’s Galaxy S7/S7 Edge, as well as the Nextbit Robin – we can expect to see another increase in numbers next month. Until next month, here’s the numbers in an easily digestible table compared to last month:
| Android Version | February | March |
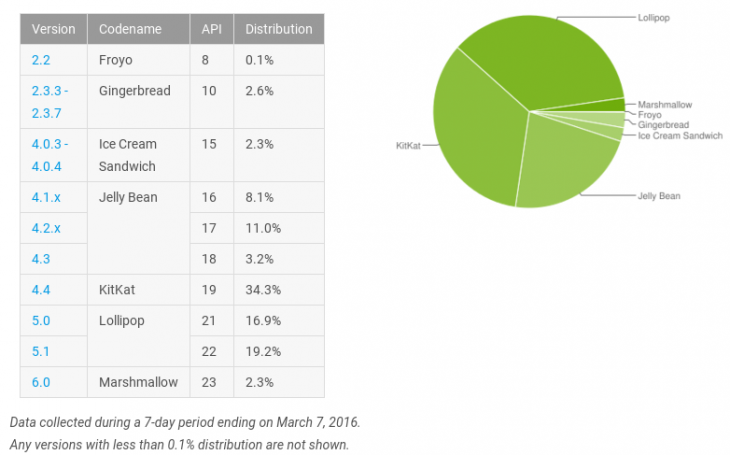
| Android 2.2 (Froyo) | 0.1% | 0.1% |
| Android 2.3.3 – 2.3.7 (Gingerbread) | 2.7% | 2.6% |
| Android 4.0.3 – 4.0.4 (Ice Cream Sandwich) | 2.5% | 2.3% |
| Android 4.1.x (JellyBean) | 8.8% | 8.1% |
| Android 4.2.x (JellyBean) | 11.7% | 11.0% |
| Android 4.3 (JellyBean) | 3.4% | 3.2% |
| Android 4.4 (KitKat) | 35.5% | 34.3% |
| Android 5.0 (Lollipop) | 17.0% | 16.9% |
| Android 5.1 (Lollipop) | 17.1% | 19.2% |
| Android 6.0 (Marshmallow) | 1.2% | 2.3% |