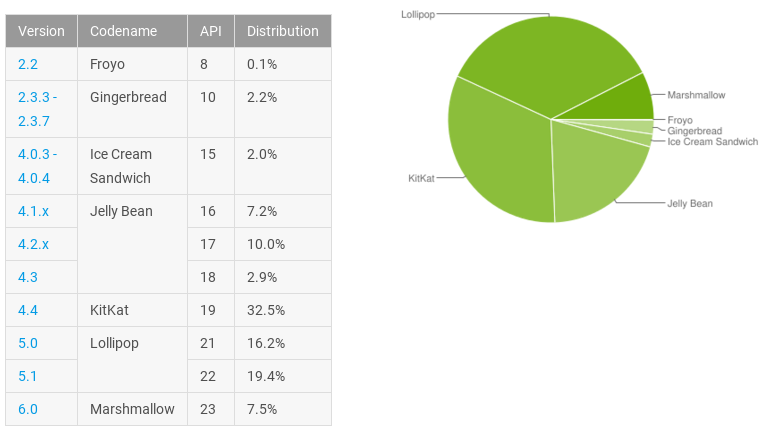
It’s early into May and Google has released the latest Android distribution numbers, based on devices using the Google Play Store in the 7-days leading up to the 2nd of May. This of course only takes into account ‘Google Android’ devices with access to Google Play, not the millions of other AOSP built devices. So, how does it look?
Well, for Marshmallow the news is all good, with share rising from 4.6% last month to 7.5% its largest market share jump to date, based most likely on the release of the LG G5 and HTC 10 in the last month. None of the other versions of Android gained market share and apart from Android version 2.2 (Froyo) which stubbornly holds on to 0.1% market share and version 5.1 (Lollipop) which remained static at 19.4%, all other versions lost market share in minor ways.
For a full run down of how it looks, here’s a comparison to last months numbers:
| Android Version | April | May |
| Android 2.2 (Froyo) | 0.1% | 0.1% |
| Android 2.3.3 – 2.3.7 (Gingerbread) | 2.6% | 2.2% |
| Android 4.0.3 – 4.0.4 (Ice Cream Sandwich) | 2.2% | 2.0% |
| Android 4.1.x (JellyBean) | 7.8% | 7.2% |
| Android 4.2.x (JellyBean) | 10.5% | 10.0% |
| Android 4.3 (JellyBean) | 3.0% | 2.9% |
| Android 4.4 (KitKat) | 33.4% | 32.5% |
| Android 5.0 (Lollipop) | 16.4% | 16.2% |
| Android 5.1 (Lollipop) | 19.4% | 19.4% |
| Android 6.0 (Marshmallow) | 4.6% | 7.5% |


