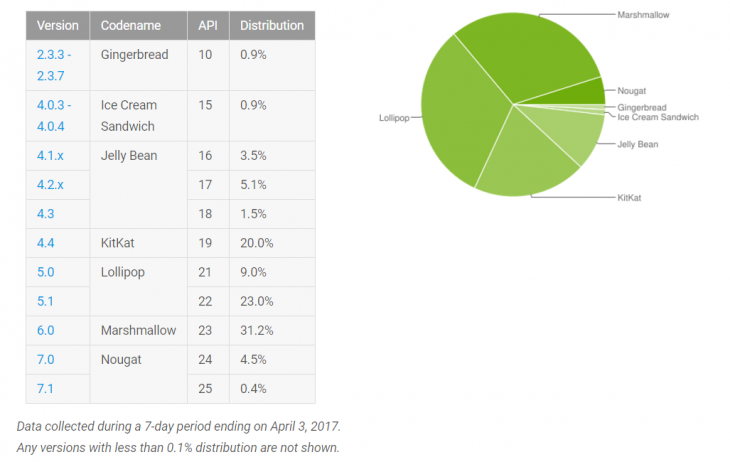
It is that time of month again where we do the dance around the new Android distribution numbers that Google have released. Let’s check out where the Android world is at.
The data is collated over 7 days by checking the version numbers of devices accessing Google Play. This of course means that any device not accessing Google Play, like a number of Android builds on devices like Amazon’s Fire tablets, and various Chinese vendors aren’t counted. But still this is a decent look.
Once again, and as expected, the very early versions of Android have not moved much at all. Not surprisingly of course because how many manufacturers are updating devices that old? The numbers will only drop when a device is no longer used. All of them decreased, albeit very slightly. In fact, every single version prior to 7.0 decreased except for 4.3 Jelly Bean which stayed at 1.5% and Nougat 7.0.
Nougat 7.0 jumped from 2.4% to 4.5% while Nougat 7.1 was constant at 0.4%. Hopefully Nougat keeps improving like that — that is two months in a row where it has basically doubled.
For the record, here’s how this months results stack up:
| Android Version | February 2017 | March 2017 | April 2017 |
| Android 2.3.3 – 2.3.7 (Gingerbread) | 1.0% | 1.0% | 0.9% |
| Android 4.0.3 – 4.0.4 (Ice Cream Sandwich) | 1.0% | 1.0% | 0.9% |
| Android 4.1.x (JellyBean) | 4.0% | 3.7% | 3.5% |
| Android 4.2.x (JellyBean) | 5.7% | 5.4% | 5.1% |
| Android 4.3 (JellyBean) | 1.6% | 1.5% | 1.5% |
| Android 4.4 (KitKat) | 21.9% | 20.8% | 20.0% |
| Android 5.0 (Lollipop) | 9.8% | 9.4% | 9.0% |
| Android 5.1 (Lollipop) | 23.1% | 23.1% | 23.0% |
| Android 6.0 (Marshmallow) | 30.7% | 31.3% | 31.2% |
| Android 7.0 (Nougat) | 0.9% | 2.4% | 4.5% |
| Android 7.1 (Nougat) | 0.3% | 0.4% | 0.4% |


Further shows the abysmal state of Android updates…
So Nexus/Pixel/AOSP devices account for 0.4% of the Android market.
Seems that way… Custom roms etc…
Sounds about right to me. There are either slightly niche not generally available on a plan (Nexus) or very high end/expensive and recent (Pixel).