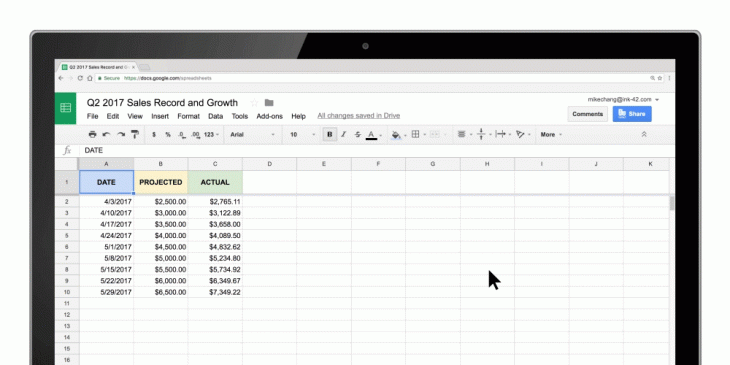
Last year Google switched a lot of their machine learning over to neural networks and have since found a big increase in the machine learning capabilities. The new machine learning is more powerful, more accurate and a lot faster than the previous version. We are seeing them roll machine learning into so many of their products, including Google Sheets. Today they have expanded the capabilities of the machine learning in Google Sheets.
Machine learning was implemented for Explore in Sheets late last year allowing the user to use sentences (as well as formulas) to analyse data. Now Google are bringing the same machine learning to the visualisation of data. Instead of building graphs and charts yourself Explore in Sheets will do it for you, as long as you ask it. An example would be: “bar chart for ice cream sales from 2015 to 2016”

This isn’t the only addition Google have made to Sheets. They have also added:
- The ability to copy data from Sheets to Docs or Slides and have it automatically sync by using the update button
- New keyboard shortcuts for Sheets
- New print interface with adjustable margins and scale and alignment options
- New sidebar to create and edit charts
- New spreadsheet functions such as “SORTN”, “GAMMADIST,” “F.TEST” and “CHISQ.INV.RT.”
These new features are rolling out to Sheets today so if you are a user head on over and check them out. If you still use the Microsoft Office versions let us know why in the comments below (I do). Alternatively, if you have made the switch to Google Sheets let us know why and how it is progressing in the comments below.


