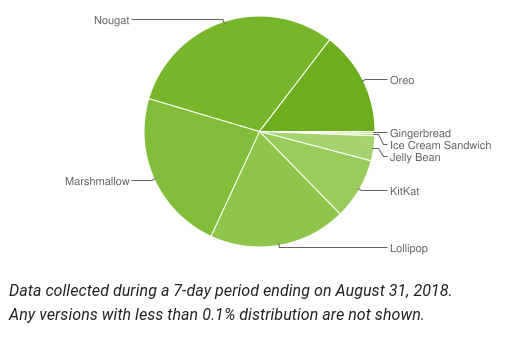
With August done for another year, Google has just released their monthly data on the distribution numbers for various versions of Android.
The data was collated by Google based on devices hitting the Google Play Store between August 24-31st. The numbers show the breadth of the Android versions, though the recently announced Android Pie has not been taken into account.
As usual we see a lot of movement in the numbers – for the most part with market share on older versions of Android up to the latest version of Nougat showing decline in usage – except for Gingerbread which saw a 0.1% increase. Android 7.1, 8.0 and 8.1 all saw small gains but it will be later this month when Google releases stats with Android 9.0 (Pie) that will be of interest with a number of manufacturers working to release a Pie update for their devices.
For your convenience, here’s the data compared to last month:
| Android Version | July 2018 | August 2018 |
| Android 2.3.3 – 2.3.7 (Gingerbread) | 0.2% | 0.3% |
| Android 4.0.3 – 4.0.4 (Ice Cream Sandwich) | 0.3% | 0.3% |
| Android 4.1.x (JellyBean) | 1.2% | 1.2% |
| Android 4.2.x (JellyBean) | 1.9% | 1.8% |
| Android 4.3 (JellyBean) | 0.5% | 0.5% |
| Android 4.4 (KitKat) | 9.1% | 8.6% |
| Android 5.0 (Lollipop) | 4.2% | 3.8% |
| Android 5.1 (Lollipop) | 16.2% | 15.4% |
| Android 6.0 (Marshmallow) | 23.5% | 22.7% |
| Android 7.0 (Nougat) | 21.2% | 20.3% |
| Android 7.1 (Nougat) | 9.6% | 10.5% |
| Android 8.0 (Oreo) | 10.1% | 11.4% |
| Android 8.1 (Oreo) | 2.0% | 3.2% |


It will be interesting to monitor the take up of OS updates over the next 12-24 months to see whether the benefits of Project Treble are actually realised, compared to the take up of previous OS releases. The Android One program should also deliver improvements in OS uptake.