It’s a new month, and that means it’s time to check out how Android is doing in terms of distribution. These figures are more an indicator of which platforms developers need to target with their apps than anything else, but let’s check it out.
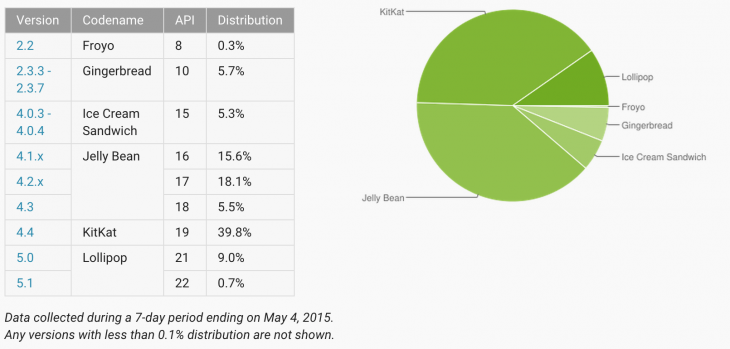
The good news is that after 7 months Lollipop is finally staring at almost 10% market share, but that takes into account Android 5.0 and Android 5.1 combined, with Android 5.0 standing at 9% market share.
The good news is that while Lollipop grew, Froyo, Gingerbread, Ice-Cream Sandwich, Jelly Bean and Kitkat all declined in market share to give Lollipop that boost.
To make it easier, here’s a comparison chart from last months numbers:
| Android Version | April | May |
| Android 2.2 (Froyo) | 0.4% | 0.3% |
| Android 2.3.3 – 2.3.7 (Gingerbread) | 6.4% | 5.7% |
| Android 4.0.3 – 4.0.4 (Ice Cream Sandwich) | 5.7% | 5.3% |
| Android 4.1.x (JellyBean) | 16.5% | 15.6% |
| Android 4.2.x (JellyBean) | 18.6% | 18.1% |
| Android 4.3 (JellyBean) | 5.6% | 5.5% |
| Android 4.4 (KitKat) | 41.4% | 39.8% |
| Android 5.0 (Lollipop) | 5.0% | 9.0% |
| Android 5.1 (Lollipop) | 0.4% | 0.7% |