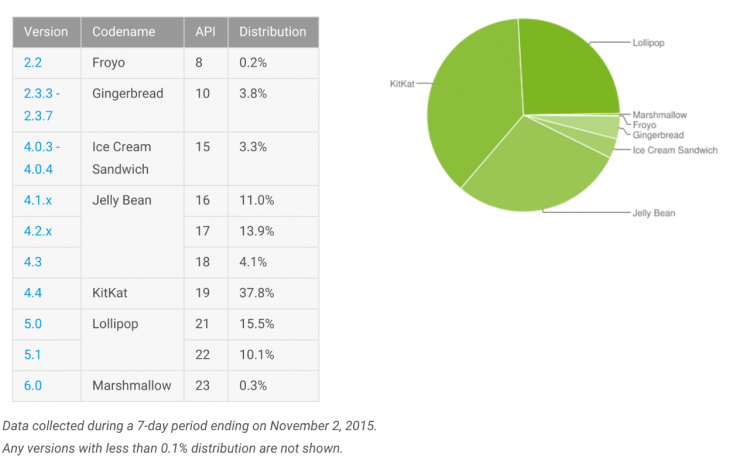
It’s a new month, so that means it’s time to look in on how the various versions of Android are doing. Google measures these numbers based on Android devices hitting the Google Play Store in the 7 days leading up to November 2nd, this obviously means it’s Google Android, so Android versions with no Play Store aren’t counted. So, what’s what?
Well. The big news is that Marshmallow is on the board. It’s only with 0.3% market share (those Nexus devices really do sell in small numbers), but it is on the board and we’ll see growth on that as manufacturers begin updating and releasing devices.
As for the rest of the Android eco-system we can see a steadying at the low end of the scale with both Froyo and Gingerbread remaining static at 0.2% and 3.8% market share, while Ice Cream Sandwich dropped just 0.1 of a percent to 3.3% market share. Jelly Bean across the range of versions it covers lost just 1.1% market share while Kit Kat lost 1.1% on its single version number. Lollipop picked it all up, with a gain across 5.0/5.1 of 2.2%.
As usual, here’s the numbers in an easily digestible table compared to last month:
| Android Version | October | November |
| Android 2.2 (Froyo) | 0.2% | 0.2% |
| Android 2.3.3 – 2.3.7 (Gingerbread) | 3.8% | 3.8% |
| Android 4.0.3 – 4.0.4 (Ice Cream Sandwich) | 3.4% | 3.3% |
| Android 4.1.x (JellyBean) | 11.4% | 11.0% |
| Android 4.2.x (JellyBean) | 14.5% | 13.9% |
| Android 4.3 (JellyBean) | 4.3% | 4.1% |
| Android 4.4 (KitKat) | 38.9% | 37.8% |
| Android 5.0 (Lollipop) | 15.6% | 15.5% |
| Android 5.1 (Lollipop) | 7.9% | 10.1% |
| Android 6.0 (Marshmallow) | % | 0.3% |